Polishing of monoclonal antibodies using Capto™ adhere ImpRes in bind and elute mode
Posted on November 3, 2014
Capto adhere ImpRes is a strong ion exchanger with multimodal functionality designed for polishing of monoclonal antibodies (MAbs). In this study, the binding capacity for MAbs and the efficiency in the clearance of impurities using Capto adhere ImpRes in bind/elute (B/E) mode was evaluated. The study presents results from optimization of the loading conditions using the Design of Experiments (DoE) approach. The effects of buffer, pH, conductivity, and sample load were investigated. Two different MAbs were studied. The results showed high yields of monomeric MAb, as well as good clearance of aggregates, host cell proteins (HCP), and leached protein A.
Introduction
MAbs and MAb conjugates are today in great demand for use as biopharamaceuticals. As a result, more cost-effective, efficient, and flexible process purification schemes are one of the highest priorities for MAb manufacturers. The relative homogeneity of MAbs makes them well-suited for platform processes, which are sets of unit operations, conditions, and methods applied to molecules of a given class. A platform approach is desirable as it saves both time and money in process development. GE Healthcare Life Sciences’ MAb production toolbox employs protein A chromatography media such as MabSelect SuRe™ or MabSelect SuRe LX for capture of the target. After the initial protein A capture step, there is a wide range of options for intermediate and polishing purification steps. One of these options, Capto adhere ImpRes, is a cost-effective and flexible chromatography medium (resin) designed for high-resolution polishing of MAbs.
Capto adhere ImpRes is a multimodal anion exchange medium with a ligand (Fig 1) that displays high selectivity compared with traditional ion exchange polishing media. The medium enables operation in either B/E or nonbinding (flowthrough, FT) modes and results in either two- or three-step purification schemes. The small bead size of Capto adhere ImpRes enables high-resolution purification of target protein. The high resolution possible with Capto adhere ImpRes enables reduced buffer consumption and improved product yield compared with Capto adhere, a related product with the same ligand but with a larger bead size. Contaminants such as DNA, HCP, leached protein A, aggregates, and viruses are efficiently separated from monomeric MAbs1 in B/E or FT modes. This application note describes development of polishing steps for two different MAbs in B/E mode using Capto adhere ImpRes. The studies include measurement of static- and dynamic binding capacities at various binding conditions, as well as screening and optimization of gradient- and step-elution conditions.

1 Capto adhere ImpRes is also be used for purification of recombinant proteins and other biomolecules.
Materials and methods
Start material
The two MAbs used in this study were initially purified from CHO cell supernatant by protein A affinity chromatography. Some characteristics of the MAbs are shown in Table 1.

Determination of static binding capacity
Static binding capacity (SBC) was determined in 6 μL PreDictor™ 96-well filter plates. Equilibration of wells in the filter plates was performed by addition of 200 μL of loading buffer per well followed by agitation at 1100 rpm for 1 min, after which the buffer was removed by vacuum extraction. The equilibration step was performed three times. MAb solution (200 μL volume, 4 mg/mL sample load, corresponding to 133 mg MAb/mL chromatography medium) was added to each well followed by agitation for 90 min. Unbound material (FT fraction) was removed by centrifugation for 3 min, and MAb concentration was determined by measurement of absorbance at 280 nm.
SBC was calculated according to:
MAbbound = 0.2 Å~ ( Cin – Cout) [mL Å~ mg/mL = mg]
SBC = MAbbound /Vmedium = MAbbound /0.006 [mg/mL]
where Cint = MAb concentration in sample, Cout = MAb concentration in FT fraction, and Vmedium = medium volume in each well (i.e., 6 μL).
Determination of dynamic binding capacity
Dynamic binding capacity (DBC) was determined by frontal analysis using .KTAexplorer™ 10 chromatography system. The UV-absorbance at 280 nm was used for determination of breakthrough. Before frontal analysis, the MAb solution was injected by-passing the column to obtain a maximum absorbance value. DBC was then calculated according to:
DBCX% = (VX% – V0 ) * C0 /Vc
were VX% = load volume (mL) at x% breakthrough, V0 = void volume (mL), C0 = MAb concentration in the sample (mg/mL) and Vc = volumetric bed volume (mL).
Screening of elution conditions
Measurement of yield at different elution conditions was performed in PreDictor 96-well filter plates. Equilibration of wells in the filter plates was performed by addition of 200 μL of loading buffer per well followed by agitation at 1100 rpm for 1 min, after which the buffer was removed by centrifugation. The equilibration step was performed three times. MAb solution (200 μL, 2.8 mg/mL, corresponding to 93 mg MAb/mL medium) was added to each well followed by agitation for 60 min. Unbound material was removed by centrifugation. Elution of bound material was then performed by addition of 200 μL elution buffer/well; the elution step was performed three times. MAb concentration was determined by measurement of absorbance at 280 nm.
Yield was calculated according to:
Yield (%) = 100 Å~ 200 Å~ ( Celuate 1 + Celuate 1 + Celuate 1)/(200 Å~ Cin) = 100 Å~ ( Celuate 1 + Celuate 1 + Celuate 1)/ Cin
where Cin = MAb concentration in MAb solution and Celuate 1, 2, 3 = MAb concentration in eluate 1 to 3.
Optimization of step elution conditions
Conditions for step elution were investigated in a packed column using .KTA™ pure chromatography system, DoE, and scouting functionalities included in UNICORN™ 6.3.
Determination of aggregates and aggregate clearance
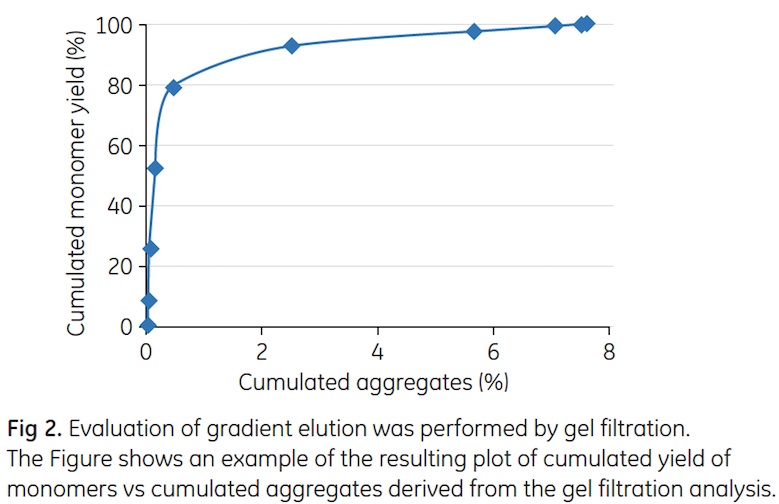
Fractions from the chromatographic runs were collected and analyzed by gel filtration (analytical size exclusion chromatography) on a Superdex™ 200 5/150 GL column. The peaks were integrated and the dimer/aggregate concentrations (in percent) were estimated. Cumulated yield of monomers was plotted against cumulated aggregates (Fig 2).
Protein A and HCP ELISA
The protein A concentration in the start materials and flowthrough fractions was determined by Protein A ELISA kit (Repligen). Host cell protein concentration was determined by HCP ELISA (Cygnus Technologies).
Results and discussion
Case study, MAb A
The case study with MAb A shows a suggested workflow for method development including screening of conditions for SBC and DBC, screening of elution conditions, and optimization of conditions for step elution.
Static binding capacity
To find optimal binding capacity for MAb A, SBC was determined in 6 μL PreDictor 96-well filter plates. Binding pH was varied between pH 4.0 and 8.02,3 and the salt concentration from 0 to 500 mM NaCl. All samples and buffers were prepared automatically using a TECAN. robot. The results show that the highest SBC was obtained at high pH and low salt concentration (Fig 3, orange region). Based on these results, a narrower range of pH and NaCl concentration was used for further investigation of conditions for DBC.
2 Binding buffers were citrate, pH 4; acetate pH 4.6 and 5.7; phosphate pH 5.7, 6.3, and 6.9; and Tris pH 7.4 and 8.0. The ionic strength from the buffer salts was kept constant at 40 mM.
3 To avoid deamidation of the MAb, pH should normally be maintained below pH 8.0.

Dynamic binding capacity
The influence of pH and salt concentration on DBC was measured by DoE using Capto adhere ImpRes packed in a Tricorn™ 5/50 column. Based on the results for SBC, binding pH was varied between pH 6.0 and 7.84 and salt concentration from 0 to 200 mM NaCl. In addition, the residence time was varied from 2 to 8 min.
The results from the DoE are shown in Figure 4. Modeling of data was performed using MODDE™ v9.0 software, resulting in a good model fit and predictive power (data not shown). In accordance with the trend for SBC, an increase in pH and decrease in salt concentration resulted in higher DBC, while lower capacity was obtained at short residence time. Further experiments described below were performed using binding with 40 mM sodium phosphate, pH 7.8.
4 Binding buffers: Sodium phosphate, 0 to 200 mM NaCl, pH 6 to 7.8. The ionic strength from the buffer salts was kept constant at 110 mM.

Screening of elution conditions
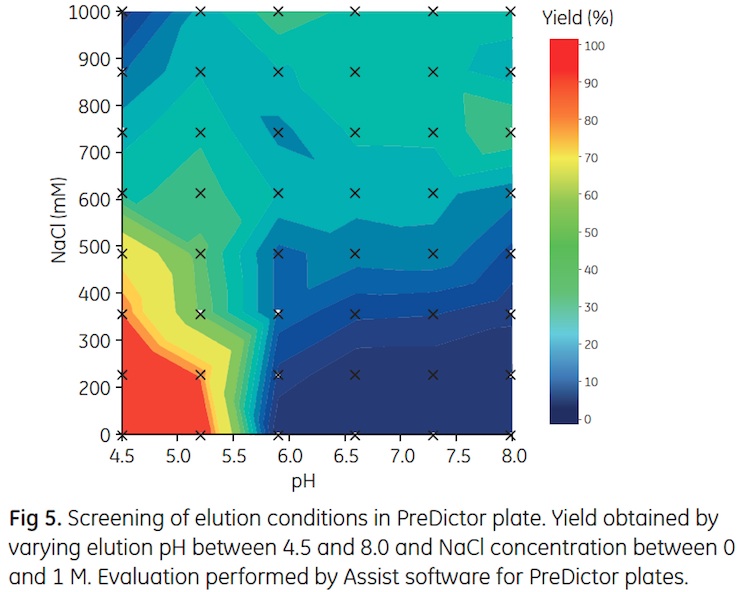
Measurement of yield at different elution conditions was performed in 96-well filter plates as described in Materials and methods. Binding was performed in 40 mM sodium phosphate, pH 7.8. Elution pH was varied between 4.5 and 8.0 and salt concentration between 0 and 1 M NaCl. The result, Figure 5, shows that the highest yield was obtained at low pH and low salt concentration. Based on this result, further studies of elution conditions were performed by gradient elution in packed columns.
Gradient elution
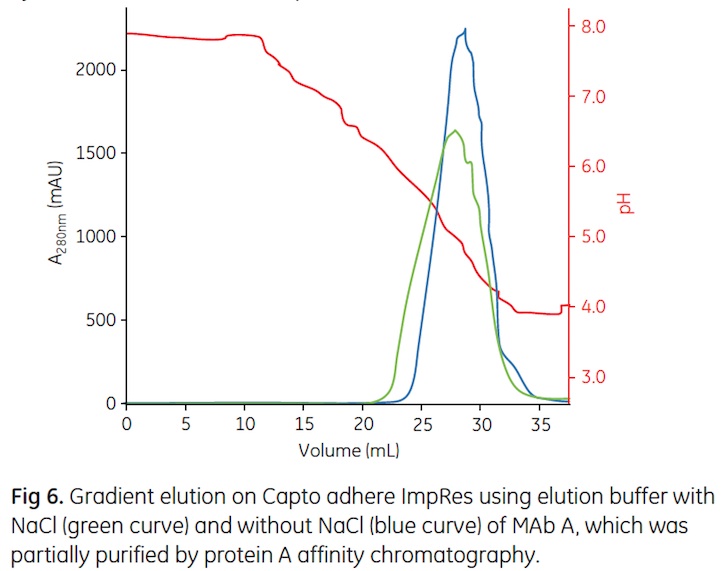
Gradient elution was performed from 40 mM sodium phosphate pH 7.8 to 20 mM sodium phosphate, 20 mM citrate, pH 4.0 with or without addition of 100 mM NaCl5. Chromatograms are shown in Figure 6. Fractions were collected and analyzed by gel filtration. Cumulated concentration of aggregates (%) vs cumulated yield of
monomeric MAb (%) was calculated according to Materials and methods. The results showed that addition of 100 mM NaCl in the elution buffer resulted in slightly lower elution pH, lower aggregate content, and a broader elution peak than elution buffer without NaCl (Table 2).
5 A mixed buffer with ionic strength that is too high might result in elution of MAb during the wash step or early in the gradient.
Column: Tricorn 5/50, column volume ~ 1 mL
Medium: Capto adhere ImpRes
Sample: MAb A, partially purified by protein A
chromatography
Sample load: 43.4 mg MAb/mL chromatography medium
Start buffer: 40 mM sodium phosphate pH 7.8
Elution buffer: 20 mM sodium phosphate, 20 mM citrate,
pH 4.0 (blue curve);
20 mM sodium phosphate, 20 mM citrate,
100 mM NaCl, pH 4.0 (green curve)
Gradient: 0% to 100% elution buffer in 20 CV
Residence time: 4 min
System: .KTAexplorer 10
Step elution
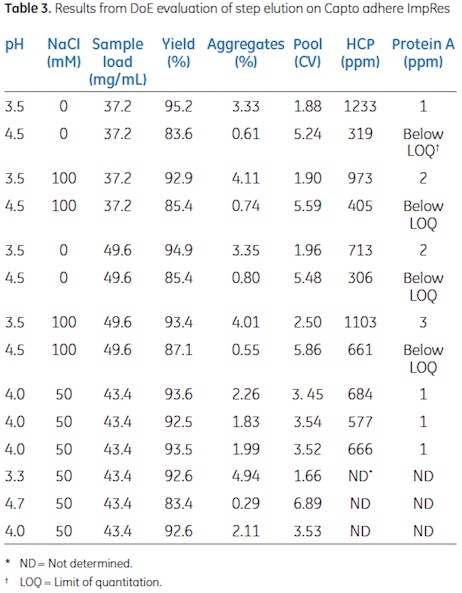
Based on results from screening in 96-well filter plates and gradient elution, conditions for step elution were further investigated in a packed column using DoE, varying sample load between ~ 50% and 70% of DBC (37.2 to 49.6 mg MAb/mL chromatography medium). Elution pH was varied between 3.5 and 4.5, and salt concentration between 0 and 100 mM NaCl. The responses from the design were yield, aggregate concentration, pool volume, HCP, and protein A concentration. The results from the design are shown in Table 3.
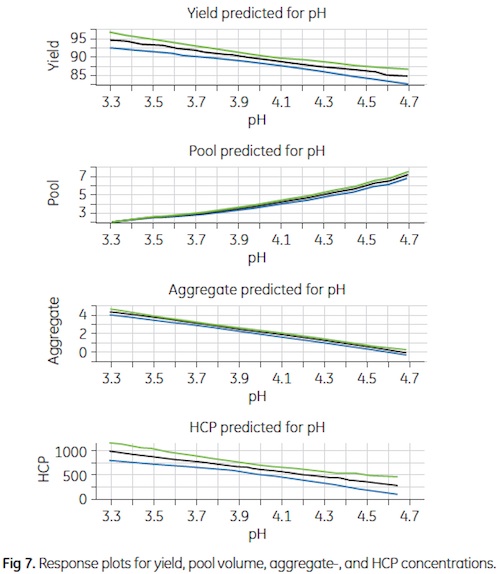
Modeling of the experimental data was performed with MODDE v9.0 software. Good models were obtained for all responses except for protein A6. The model showed that the only significant factor was elution pH. Thus, a higher elution pH resulted in lower yield, lower aggregate concentration, higher pool volume, and lower HCP concentration (Fig 7). 6 As the values and the variation of protein A concentration in the elution pools were very low, no model could be obtained for this response.
Verification of the design
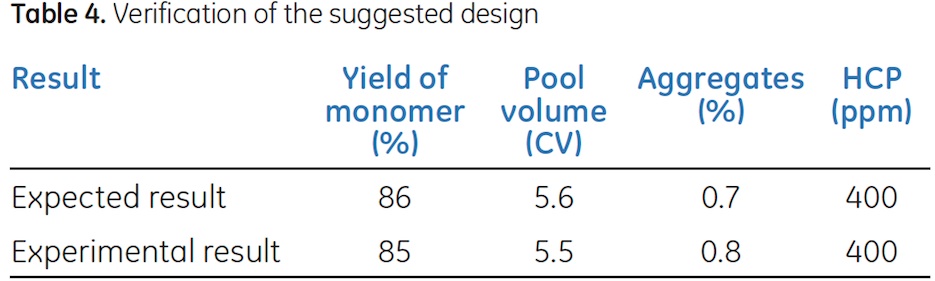
The model suggested an elution pH of 4.5 (0 M NaCl) and a sample load of 70% of DBC (≈ 50 mg/mL). Column verification of the method was performed in a Tricorn 5/50 column. The obtained result was in good agreement with the expected result for yield, pool volume, aggregate-, and HCP clearance (Table 4). The relatively high initial HCP level in the sample used accounts for the high HCP level after polishing. HCP levels could be further reduced, either by including a wash step before elution of the MAb or by addition of a third purification step.
Case study, MAb B
The related multimodal anion exchanger, Capto adhere, has been successful for MAb polishing in FT mode. However, Capto adhere has also found use in B/E mode, even though the particle size is not optimal. In a case study using MAb B, the performance of Capto adhere in B/E mode was compared to that of Capto adhere ImpRes, considering DBC at various residence times, and gradient and step-elution conditions.
Static and dynamic binding capacity
SBC and DBC for MAb B were determined using the same methodology as shown in the first case study. Highest SBC and DBC were obtained at high pH and low ionic strength (i.e., 20 mM sodium phosphate, pH 7.87). 7 To avoid deamidation of the MAb, pH should normally be maintained below pH 8.0.
Dynamic binding capacity vs residence time
DBC at 10% breakthrough for Capto adhere ImpRes and Capto adhere was measured at different residence times (linear flow rates) in the range of 1 to 10 min. As seen in Figure 8, DBC for Capto adhere ImpRes is higher and less sensitive to residence time than Capto adhere. Capto adhere ImpRes can therefore be operated at shorter residence times (i.e., higher flow rates) while maintaining process robustness with regard to capacity8.
8 Due to pressure-flow limitations, a maximum bed height of 10 cm is recommended at 2 min residence time.

Gradient elution
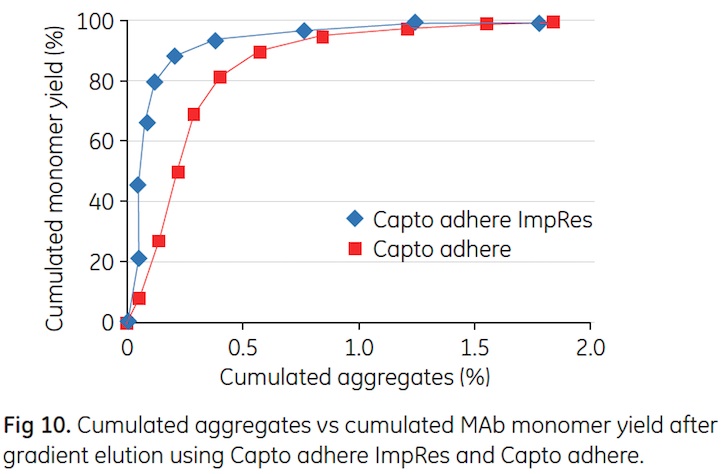
Gradient elution by pH was performed on Capto adhere ImpRes. Unlike the example with MAb A, addition of NaCl to the elution buffer resulted in a narrower elution peak (Fig 9, green curve). Collected fractions were analyzed by gel filtration and cumulated yield of monomer was plotted against cumulated concentration of aggregates. The result shows good separation between monomer and aggregates, and that separation was improved on Capto adhere ImpRes compared with Capto adhere (Fig 10).
Column: Tricorn 5/50, column volume ~ 1 mL
Medium: Capto adhere ImpRes
Sample: MAb B, partially purified by protein A
affinity chromatography
Sample load: 30 mg/mL
Start buffer: 28 mM sodium phosphate, pH 7.75
Elution buffer: 30 mM sodium phosphate, 25 mM citrate,
pH 4.1 (blue curve)
30 mM sodium phosphate, 25 mM citrate,
pH 4.1 + 250 mM NaCl (green curve)
Gradient: 0% to 100% elution buffer in 20 column volumes (CV)
Residence time: 4 min
System: .KTAexplorer 10
Step elution
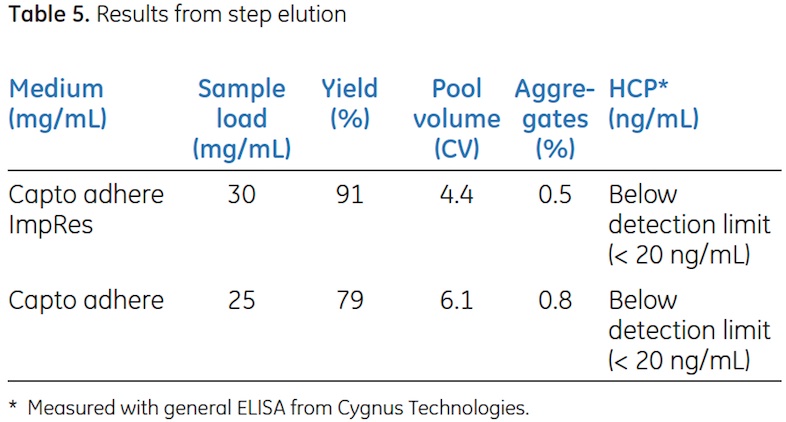
From the gradient elution results above, step elution from Capto adhere ImpRes and Capto adhere was performed at pH 6.5 and 62.5 mM NaCl (i.e., 25% of elution buffer, Fig 11). The sample load was 70% of DBC 10%. Fractions were pooled and analyzed for yield, aggregate-, and HCP concentration. Despite 20% higher load, step elution from Capto adhere ImpRes resulted in higher yield and improved aggregate clearance compared to Capto adhere (Table 5). HCP levels were below the detection limit for ELISA.
Column: Tricorn 5/50, column volume ~ 1 mL
Sample: MAb B, partially purified by protein A
affinity chromatography
Sample load: 30 mg/mL
Start buffer: 28 mM sodium phosphate, pH 7.75
Elution buffer: 30 mM sodium phosphate, 25 mM citrate,
250 mM NaCl, pH 4.1
Step elution: 25% elution buffer (pH 6.5, 11.3 mS/cm)
Residence time: 4 min
System: .KTA pure


Conclusions
In this work, we present results from two case studies using Capto adhere ImpRes, a multimodal anion exchanger designed for polishing. Two different MAbs were purified in B/E mode. The results show high yields of MAb monomers, good clearance of aggregates, HCP, and leached protein A.

For local office contact information, visit
www.gelifesciences.com/contact
www.gelifesciences.com/bioprocess
GE Healthcare Bio-Sciences AB
Bj.rkgatan 30
751 84 Uppsala
Sweden
GE, imagination at work, and GE monogram are trademarks of General
Electric Company.
.KTA, .KTAexplorer, Capto, MabSelect SuRe, PreDictor, Superdex,
Tricorn, and UNICORN are trademarks of GE Healthcare companies.
MODDE is a trademark of Umetrics. Tecan is a trademark of Tecan
Group Ltd., M.nnedorf, Switzerland.
˝ 2013 General Electric Company – All rights reserved.
First published March 2013.
All goods and services are sold subject to the terms and conditions of
sale of the company within GE Healthcare which supplies them. A copy
of these terms and conditions is available on request. Contact your local
GE Healthcare representative for the most current information.
GE Healthcare UK Limited
Amersham Place
Little Chalfont
Buckinghamshire, HP7 9NA
UK
GE Healthcare Europe, GmbH
Munzinger Strasse 5
D-79111 Freiburg
Germany
GE Healthcare Bio-Sciences Corp.
800 Centennial Avenue, P.O. Box 1327
Piscataway, NJ 08855-1327
USA
GE Healthcare Japan Corporation
Sanken Bldg., 3-25-1, Hyakunincho
Shinjuku-ku, Tokyo 169-0073
Japan
Related Topics and Keywords
bind and elute mode, binding capacity for MAbs, Capto™ adhere ImpRes, clearance of impurities, conductivity, design of experiments, DOE, GE Healthcare, good clearance of aggregates, HCP, high yields of monomeric MAb, host-cell proteins, ion exchanger, leached protein A, loading conditions, mAbs, manufacturing, monoclonal antibodies, multimodal functionality, optimization, pH, polishing, Polishing of monoclonal antibodies, sample load
Subscribe to our FREE newsletter and WEBINAR UPDATES
We will not sell or give your information to a third party. See our Privacy Policy